Figure
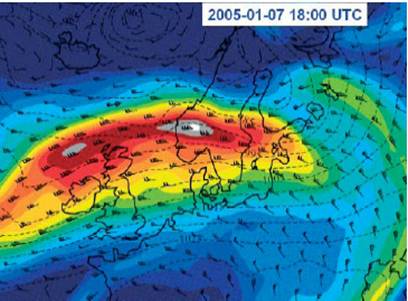
1. Wind at altitude of 9km for 18:00GMT on 7th January, 2005 . The
black dashed lines are the surface isobars. The regions of constant
wind are indicated by colouring using the dark red colours to represent
areas with wind speeds higher than 80 m/s .
Source: Danish Met Institute (www.dmi.dk)