|
|
|||
 Home
Home |
|||
| CV
|
|||
| Publications |
|||
| Research |
|||
|
|||
| Contact |
|||


Windstorm Erwin
Storm formation and track
Associated damage and insured losses
Just west of Ireland at 1800GMT on January 7th a
perturbation in the polar front led to the formation of windstorm
Erwin, whose central pressure at formation was 995mb. Strong
upper-level winds, associated with the jet stream, were located aloft
of the surface storm, drawing air from below, leading to upper air
divergence and intensifying the pressure reduction (see Figure 1).
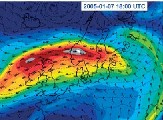 Figure 1. Click on image to open in a new window
Rapid intensification over the next twelve hours led to the central pressure deepening 25mb as the storm began to track towards the Northern Irish coastline. Erwin moved across Northern Ireland and Scotland, bringing severe gales on its southern flank to the rest of British Isles. A gust of 55m/s was recorded at St. Bees Head (Cumbria), with Capel Curig (Snowdonia) receiving 144mm rainfall in 24 hours on January 7th , while Shap (Cumbria) received a 72 hour total of 227mm.
By the morning of the 8th January (0600GMT) the centre of the storm was located just east of the UK, having seen its central pressure drop to 970mb. At this stage the majority of depressions begin to weaken as they track over northern Europe as a result of surface friction and unsupportive upper air. However, a jet streak was still positioned directly over the centre of the storm and led to further intensification.
Figure 2 is a thermal
satellite picture in the 10.3-11.3µm range (infra-red) taken at 1147GMT
on 8th January. The cloudless region, highlighted with the red arrow,
indicates a tongue of very dry air being dragged down from upper atmospheric levels,
bringing the strong winds above the depression to the surface. This
feature is known as a “sting jet” as the cloud feature, seen in Figure
2, looks similar to a scorpions tail. The most damaging winds in the
UK, Denmark and Sweden are most likely due to the sting jet.
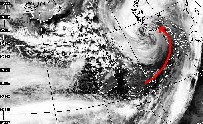 Figure 2. Click on image to open in a new window
Erwin
deepened and tracked to the north of Denmark over Norway, reaching its
minimum pressure of 960mb on the afternoon of the 8th, just north-east
of Oslo, Norway. Peak gusts of 40m/s were recorded at coastal weather
stations over Denmark. Damaging gusts persisted over Denmark for
4-5 hours as the storm passed relatively quickly, moving into Sweden on
the 8th. Hurricane strength winds were recorded for the first time
since 1999, as Hano, an island off the coast of Sweden, experienced
gusts of up to 42m/s.
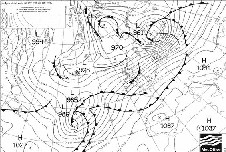 Figure 3: Click on image to open in a new window
Figure 3 shows an analysis chart at 0000GMT on 9th January 2005. The steep pressure gradient between north and south Sweden, illustrated by the tight isobars, resulted in high windspeeds.
As Erwin continued to move eastward it weakened, filling slowing but still bringing high winds and rainfall to Germany, Latvia, Estonian and Lithuania.
In Britain three people died, while 70,000 homes lost power following heavy rain and powerful winds. A month's rainfall fell in parts of the Lake District in just 3 days, causing several rivers to burst their banks. Extensive flooding in Carlisle saw 30,000 homes lose their power and 3,000 people evacuated as flood waters reached 1.8m before subsiding on 9th January. Royal and Sun Alliance estimated their losses to be in the region of £20m in the UK alone, while industry wide losses for the UK were approximately £250m (Guy Carpenter, 2005). The majority of the insured loss resulted from flooding.
Denmark and southern Sweden suffered flooding and wind damage as the storm passed over on 8th and 9th January. Windspeeds of 40m/s were recorded in the north-western part of Jutland in Denmark, which, coupled with high tides, led to the sea level rising to 2m above normal. Subsequent heavy coastal flooding in this region resulted in four fatalities and the loss of power to 60,000 households. Projected insured loss for Denmark stands at £433m (Guy Carpenter, 2005).
Sweden recorded its worst storm in 35 years with nine fatalities and 400,000 homes losing power. Windspeeds of 33m/s were recorded inland, resulting in unprecedented damage to the forestry industry, with an approximately 75 million cubic metres of trees falling with an estimated cost of £1.6-2.3bn. Damage was so high partly due to the antecedent conditions of moist soils resulting from the mild and wet winter. Claims from the forestry and agricultural industry make up the majority of the estimated £232m insured loss in Sweden.
According to Swiss Re, industry-wide insured losses relating to Windstorm Erwin stand at £1.1bn.
References
Guy Carpenter (2005).
Windstorm Erwin/Gudrun - January 2005. Speciality Practice Briefing -
An update from the Property Speciality, Guy Carpenter & Company
Ltd: 14.
Zanetti, A. (2006). Natural Catastrophes and man-made disasters 2005. Sigma. Zurich, Swiss Re: 40.
 This
page was last updated on
20th October 2009. Every effort is made to ensure links from this page
are still active; however, if you find they are not please let me know.
This
page was last updated on
20th October 2009. Every effort is made to ensure links from this page
are still active; however, if you find they are not please let me know.